Attack Analytics, launched this May, aimed to crush the maddening pace of alerts that security teams were receiving. For security analysts unable to triage this avalanche of alerts, Attack Analytics condenses thousands upon thousands of alerts into a handful of relevant, investigable incidents. Powered by artificial intelligence, Attack Analytics is able to automate what would take a team of security analysts days to investigate and to cut that investigation time down to a matter of minutes.
Building upon the success of our launch, we are now introducing the Attack Analytics Dashboard. Aimed at SOC (Security Operations Center) analysts, managers, and WAF administrators to provide a high-level summary of the type of security attacks that are hitting their web applications; it helps to speed up security investigations and quickly zoom in on abnormal behaviors.
The WAF admin or the SOC can use the Dashboard to get a high-level summary of the security attacks that have happened over a period of time (the last 24 hours, 7 days, 30 days, 90 days or other customized time range):
- Attack Trends: Incidents and events
- Top Geographic Areas: Where attacks have originated
- Top Attacked Resources
- Breakdown of Attack Tool Types
- Top Security Violations (Bad Bots, Illegal Resource Access, SQL injections, Cross-Site Scripting, etc.)
Events vs. incidents
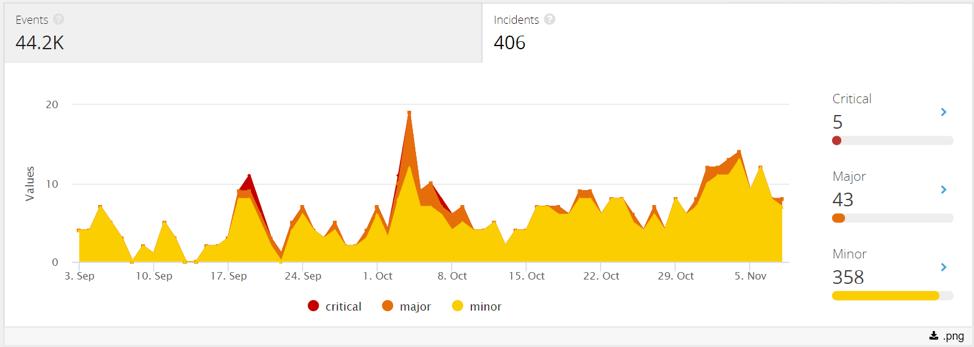
Upon entering the Attack Analytics Dashboard, you can see the Incidents tab, which shows the attack trends across time, classified according to severity (critical, major and minor). A quick scan allows you to understand if a sudden jump in incidents may deserve immediate attention.
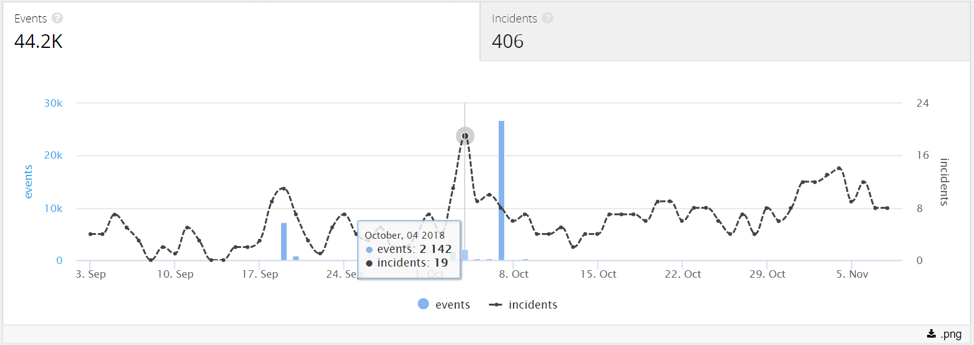
In the Events tab, you can see the number of events vs. incidents which have occurred over a specific period of time. For example – the marked point in the graph shows that on October 4th there were 2,142 alerts that were clustered into 19 security incidents. If you want to understand what happened on this day, you can drill down and investigate these 19 incidents.
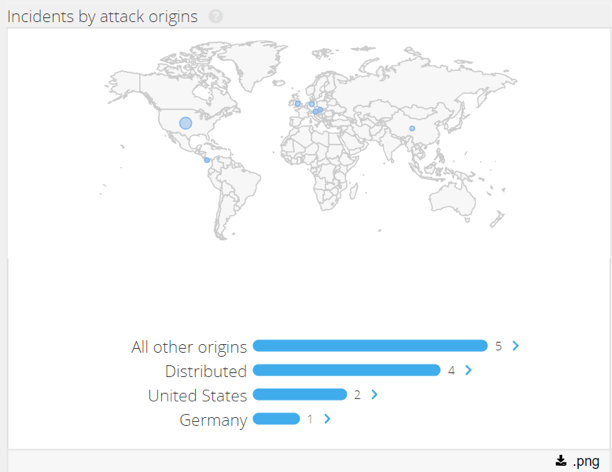
Next, you can see the Top Attack Origin countries which have attacked your websites over a specified period of time. This again could help identify any abnormal behavior from a specific country. In the snapshot below, you can see the “Distributed” incidents. This means that this customer experienced 4 distributed attacks, with no dominant country, and could imply the attacks originated from botnets spread across the world.
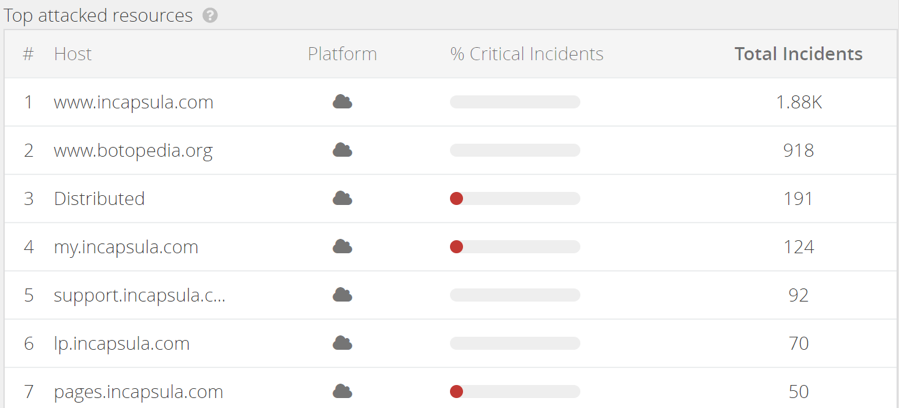
Top attacked resources
Top Attacked Resources provides a snapshot of your most attacked web resources by percentage of critical incidents and the total number of incidents. In this example, singular assets are examined as well as a distributed attack across the customer’s assets. In the 3rd row, you can see that the customer (in this case, our own platform) experienced 191 distributed attacks. This means that each attack targeted a few hosts under our brand name; for example, it may have been a scanning attack aimed at finding vulnerable hosts.
Attack tool types
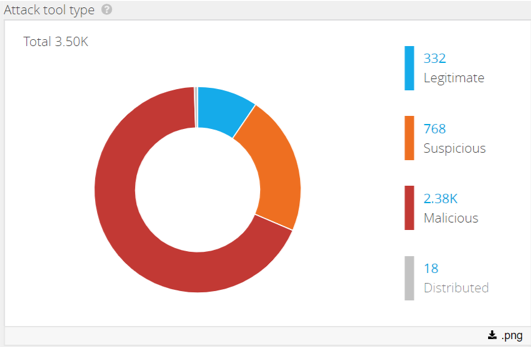
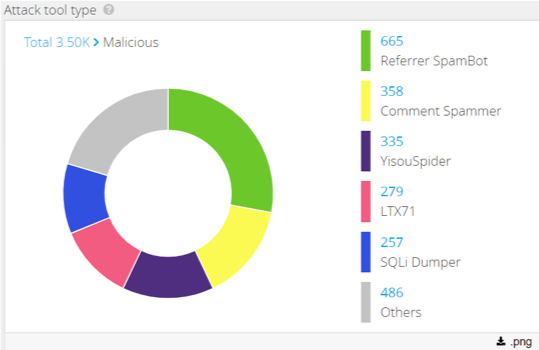
A SOC Manager/WAF admin might also want to understand the type of attack tools that are being used. In the example below, on the left, you see the distribution of incidents according to the tool types and on the right, you see the drill-down into the malicious tools, so you can better understand your attack landscape. Over the last 90 days, there were 2.38K incidents that used malicious tools. On the right we can see the breakdown of the different tools and the number of incidents for each one – for example, there were 279 incidents with a dominant malicious tool called LTX71.
We think you’ll quickly discover the benefits which the new Attack Analytics Dashboard provides as it helps you pinpoint abnormal behaviors and speed up your security investigations. It should also assist you in providing other stakeholders within your company a high-level look at the value of your WAF.
And right now, we have even more dashboard insight enrichments in the works, such as:
- False Positives Suspects: Incidents our algorithms predict to be highly probable of being false positives.
- Community Attacks (Spray and Pray Attacks): Provide a list of incidents that are targeting you as part of a larger campaign – based on information gathered from our crowdsourced customer data.
Stay tuned for more!
The post Read: New Attack Analytics Dashboard Streamlines Security Investigations appeared first on Blog.


